
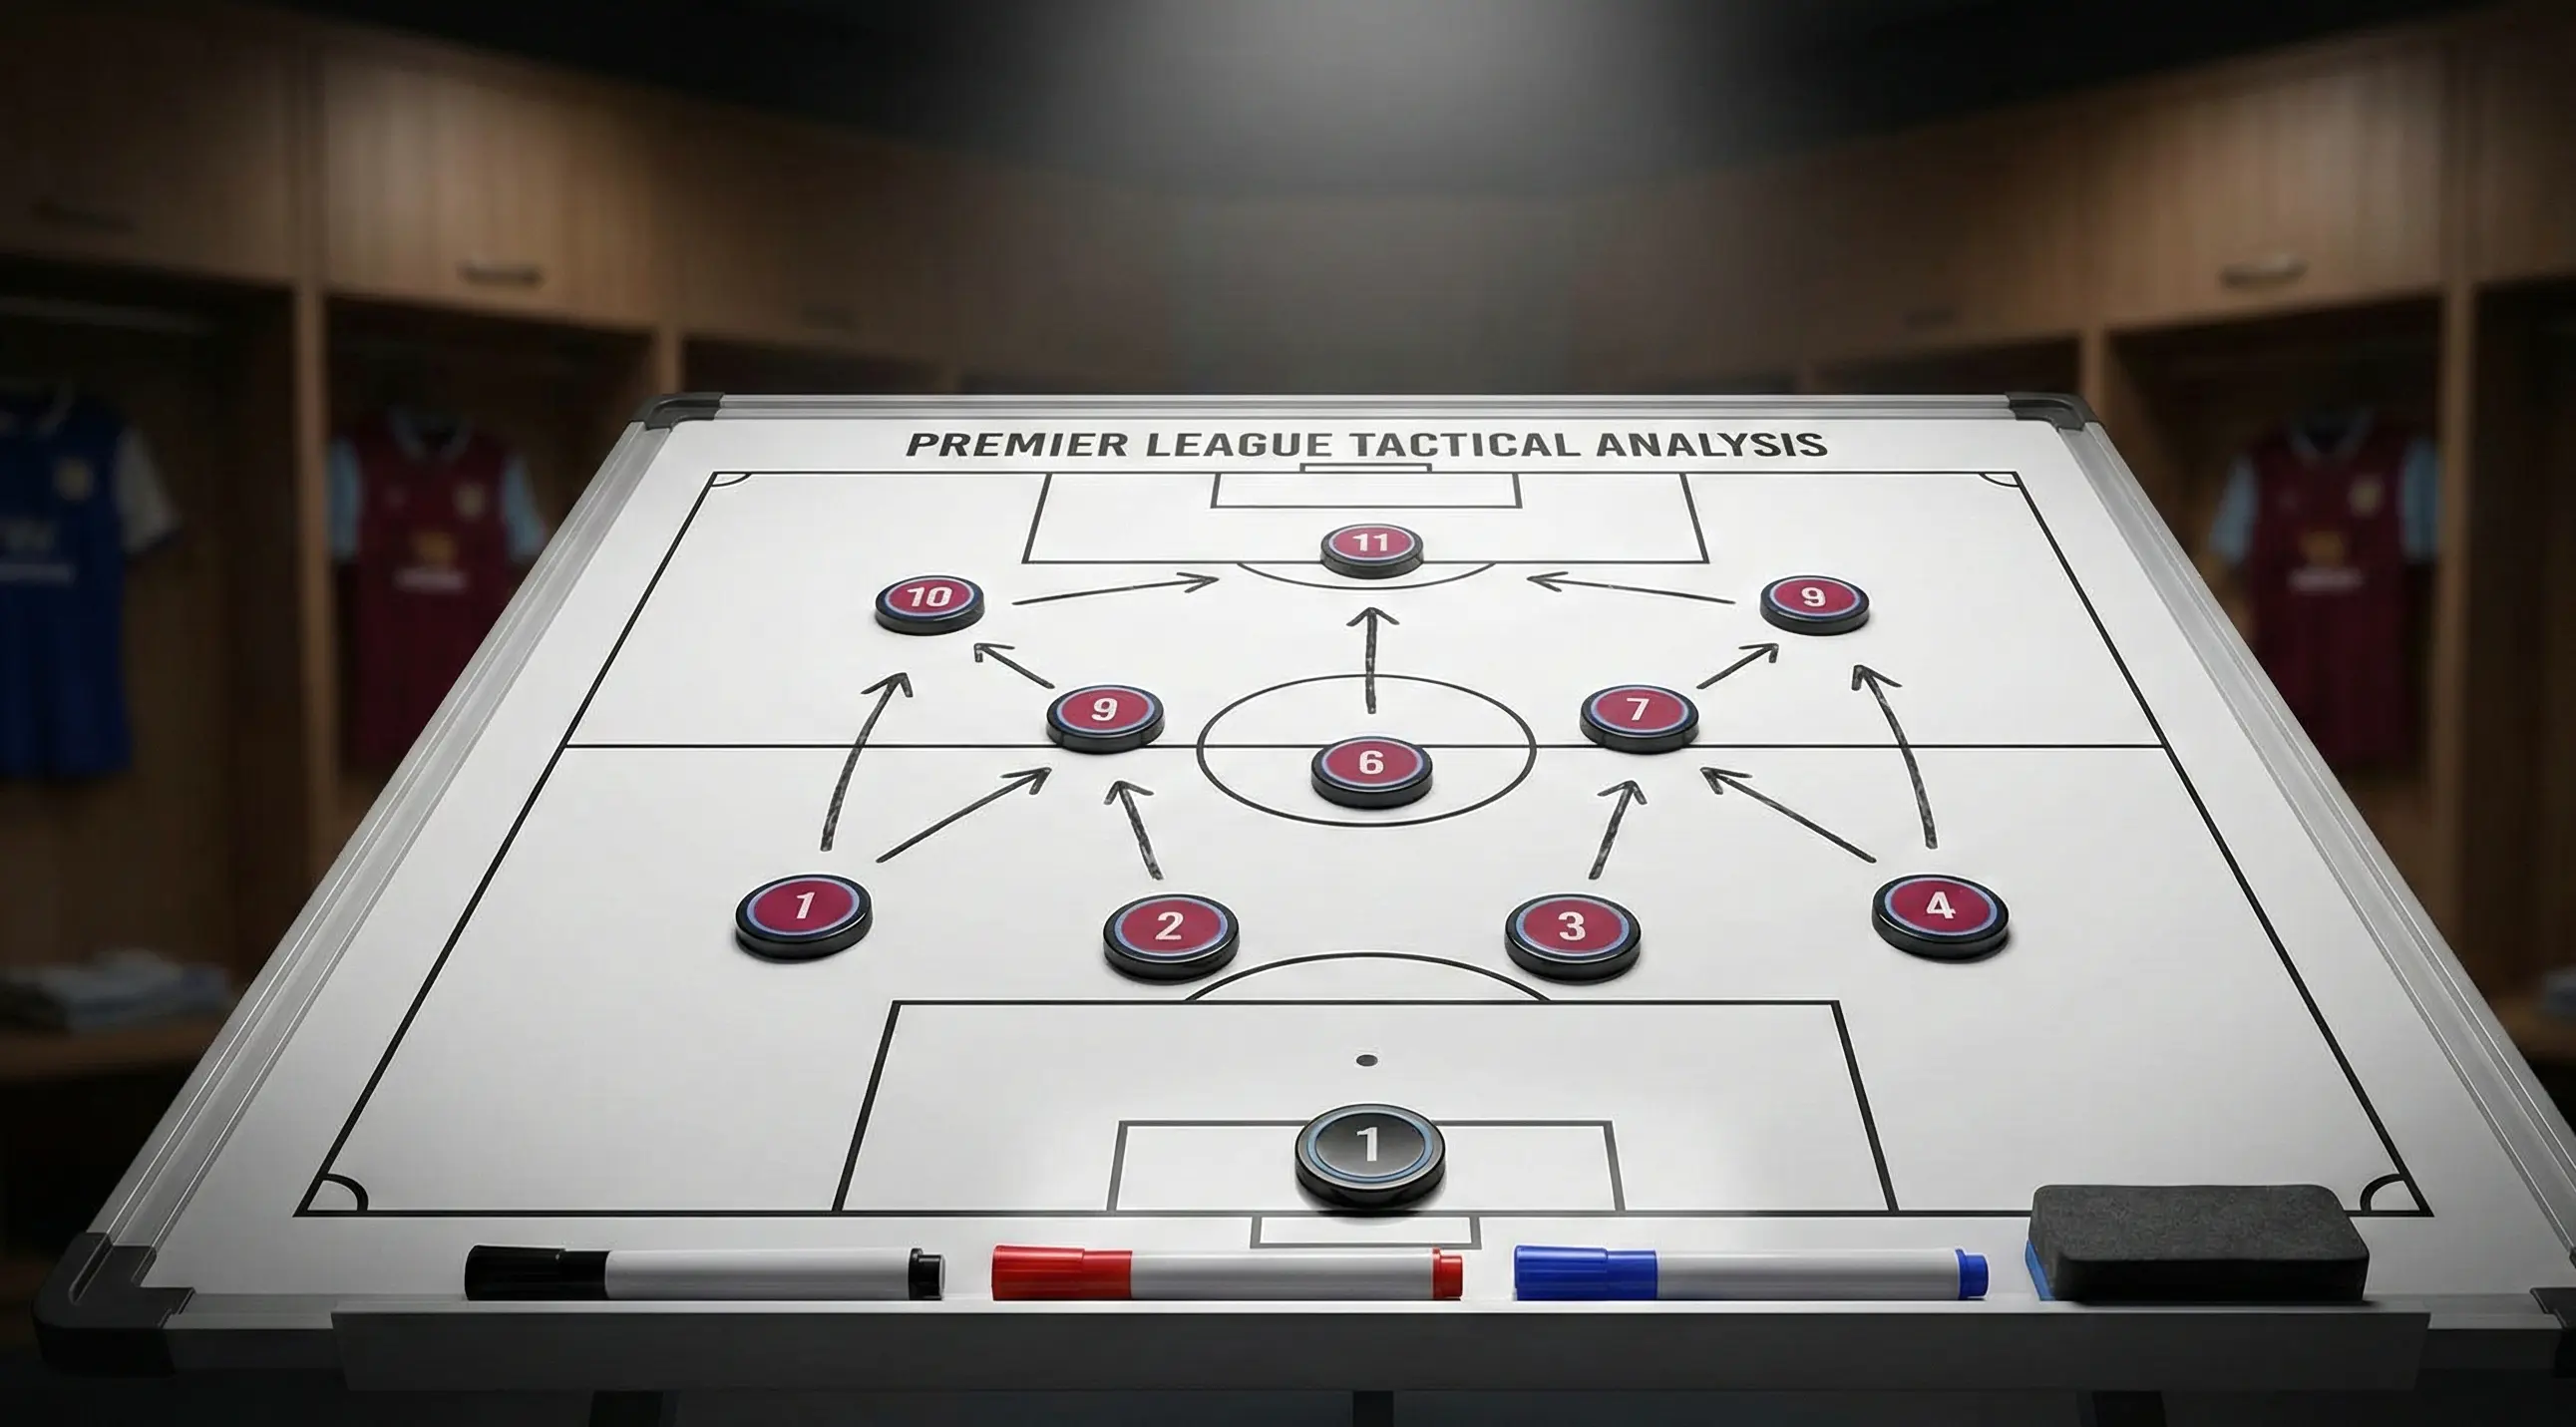
The most valuable information in Carabao Cup betting isn’t available in any statistics database. It lives in the gap between what the market expects and what actually happens—the lineup. Every match offers the same sequence: bookmakers set odds based on assumptions about team selection, then reality arrives one hour before kickoff and those assumptions prove right or wrong. The bettors who predict lineups more accurately than bookmakers gain a structural edge that persists across entire seasons.
This isn’t about guessing starting elevens correctly. That’s impossible with any consistency. It’s about estimating rotation severity—how many changes a manager will make, which positions will change, and whether the overall team quality will be 90% of first-choice or 60%. These estimates, when more accurate than market pricing, identify value before team news confirms or denies your assessment.
The Variables That Predict Rotation
Managers don’t rotate randomly. Their decisions follow patterns shaped by identifiable factors, and tracking these factors allows systematic prediction. The four primary variables are fixture proximity, opponent quality, competition stage, and squad health. Each contributes independently to rotation likelihood, and their interaction determines the final selection.
Fixture proximity is the strongest single predictor. A Premier League match occurring within 72 hours of a cup tie almost guarantees heavy rotation from any manager competing seriously for the title or European places. The recovery science is clear: players performing at high intensity need minimum 72 hours before similar exertion to avoid injury risk spikes. Managers know this, sports science departments enforce it, and selection reflects reality. When City play on Sunday and face a cup match on Tuesday, expect eight or more changes regardless of opponent.
The days between matters precisely. Three days’ rest (the minimum gap) produces maximum rotation. Four days allows retention of some key players. Five or more days—rare in modern fixture congestion—might see near-full strength selections if the cup opponent warrants respect. Track the actual hours between kickoffs, not the apparent gap between matchdays. A Sunday evening kickoff followed by a Wednesday evening match provides more recovery than Saturday afternoon followed by Tuesday evening, despite the same number of calendar days.
Opponent quality influences retention decisions for specific positions rather than overall rotation levels. Against League Two opposition, even rested first-choice players might sit because the developmental value of youth exposure outweighs marginal competitive benefit. Against Championship leaders or dangerous cup specialists, managers keep their spine—goalkeeper, center-back pairing, holding midfielder—while rotating peripheral positions. The differential treatment by position creates specific market angles: defensive solidity might remain even when attacking threat diminishes significantly.
Building Historical Rotation Databases

The data exists to predict rotation patterns with surprising accuracy, but you must compile it yourself. No commercial database tracks “number of lineup changes between cup and league matches by manager.” Creating this dataset requires reviewing historical teamsheets across seasons, but the time investment pays continuous dividends.
For each Premier League manager, record their cup rotation patterns across at least two seasons. Note: how many changes were made by round, what positions were prioritized for rest versus retention, which players never rotated regardless of circumstances, and how contextual factors (fixture proximity, league position, injury status) modified typical patterns. Patterns emerge quickly. Guardiola rotates his goalkeeper in early rounds without exception. Arteta keeps at least one experienced center-back regardless of opponent. Slot rests his entire senior spine when European football looms.
The historical baseline provides your prediction starting point. Then adjust for current context. Is this season’s squad deeper or shallower than usual? Have injuries hit positions that were previously rotation-resistant? Has the manager’s public commentary shifted regarding cup priority? Each adjustment refines your probability estimate for heavy versus moderate versus light rotation.
Quantify your estimates numerically. Instead of vague predictions like “City will rotate,” estimate ranges: “City will make 8-10 changes with 75% probability, 6-7 changes with 20% probability, and 5 or fewer changes with 5% probability.” This precision forces rigorous thinking and enables comparison against implied market probabilities. If your estimate suggests 75% chance of heavy rotation but odds reflect only 50% adjustment, you’ve identified potential value.
Press Conference Analysis and Social Media Intelligence
The 48 hours before matchday provide critical signals that refine rotation predictions. Managers communicate through press conferences, training ground photography reveals availability, and social media creates accidental leaks. Each source carries information value if interpreted correctly.
Press conference language follows consistent patterns. When managers emphasize upcoming league fixtures, expect heavy cup rotation. When they praise the cup opponent’s quality or discuss the competition’s importance, expect stronger selections. Specific player mentions indicate likely starters—a manager asked about a fringe player’s “readiness” typically plans to start that player. Injury updates that confirm first-choice availability raise retention probability, while hesitation or vagueness about fitness suggests precautionary rest.
Training ground intelligence has become increasingly valuable as fan photography spreads across social media. Players pictured in full training within 48 hours of cup matches are likely available. Those absent might be injured, might be resting, or might simply have arrived late that day. Cross-reference training images with official injury updates to distinguish genuine unavailability from strategic rest.
Team travel lists occasionally leak before matches. Clubs announce traveling squads, airport spotters identify players boarding flights, and hotels post guest lists that fans decode. This information, while imperfect, narrows lineup possibilities. A player not traveling cannot start—that certainty eliminates prediction scenarios and sharpens estimates for remaining positions.
European Fixture Integration
Champions League and Europa League fixtures create the most predictable rotation triggers. Clubs competing in Europe face fixture sequences that make full-strength cup lineups physically impossible. Understanding European scheduling allows lineup prediction weeks in advance.
The calendar matters precisely. European group stages cluster matches in September, October, November, and December—exactly when Carabao Cup rounds two through five occur. A club playing Champions League on Tuesday will rotate heavily for any domestic cup match within seven days. This isn’t preference; it’s physiological necessity recognized by every modern sports science department.
The level of European competition affects rotation magnitude. Champions League clubs, facing the highest-quality opposition and traveling further, require maximum recovery protocols. Europa League clubs experience slightly less stress. Conference League clubs might view the domestic cup as equal or greater priority, reducing rotation. Assess each club’s European status to calibrate cup rotation expectations.
Qualification scenarios intensify rotation decisions. A club needing a European group-stage result for qualification will empty the tank for that match and field reserves in surrounding cup fixtures. A club already qualified might rest European starters and prioritize domestic cups as their route to tangible success. Track group standings and qualification permutations to anticipate these strategic shifts.
Position-Specific Rotation Patterns
Not all positions rotate equally. Understanding which roles managers prioritize for rest versus retention improves prediction accuracy for formation and style as well as personnel.
Goalkeepers typically rotate in blocks. Most Premier League clubs now carry dedicated cup goalkeepers who play every domestic cup minute until late rounds. Kepa Arrizabalaga serves this role for Arsenal; Stefan Ortega and James Trafford rotate at City. Predicting goalkeeper rotation is straightforward: check who played the previous cup round and expect the same unless progression to semi-finals triggers first-choice restoration.
Central midfield presents complex decisions. Most managers believe midfield orchestration requires understanding and rhythm that diminishes significantly with rotation. One holding midfielder might remain as the experienced head while attacking midfielders rotate freely. This pattern explains lineups where six or seven players change but the deep-lying playmaker stays constant.
Full-backs rotate heavily because the position’s demands—repeated sprints covering vast distances—create outsized fatigue. Modern inverted full-back roles sometimes protect players more, but traditional overlapping systems exhaust practitioners quickly. Expect back-up full-backs in almost every rotated cup lineup unless injury leaves no alternative.
Strikers divide into two categories: those managed carefully due to injury history or contract situations, and those whose goalscoring instincts require regular match action. Managers sometimes start backup strikers in cup matches specifically to maintain sharpness for league deployment as substitutes. Other times, misfiring first-choice strikers start cup matches hoping easier opposition restores confidence. Understanding each club’s striker dynamic aids prediction.
Converting Predictions to Betting Actions

Lineup predictions only matter if they identify betting opportunities. The conversion process requires comparing your estimated team quality against implied market probabilities.
Calculate your expected team strength as a percentage of first-choice capability. Heavy rotation might produce 60% quality; moderate rotation 75%; light rotation 90%. These percentages, while imprecise, enable consistent comparison across scenarios. If you estimate City’s rotated side at 70% first-choice quality against Brentford’s full-strength 100%, the relative strength differs dramatically from City at 95% first-choice quality.
Compare your relative strength estimate against market odds. If odds price City as prohibitive favorites regardless of rotation severity, and you’ve predicted heavy rotation, the market may have underadjusted. Backing Brentford on Asian handicap or the over on total goals might offer value. If odds have already adjusted heavily for rotation you expect to be moderate, backing City to cover larger handicaps might work.
The precision matters less than the framework. Perfect lineup prediction is impossible; directionally accurate rotation estimation is achievable. Build your prediction system, track its accuracy across rounds, and refine based on results. The bettors who profit from lineup analysis aren’t clairvoyant—they’re systematic about turning available information into probability estimates that outperform market assumptions.
