

Standard football betting models optimize for league prediction: they weight historical results, xG differentials, home advantage, and squad quality to estimate match outcome probabilities. These models work reasonably well for competitions where teams field consistent lineups across dozens of fixtures, allowing historical performance to predict future results. But the Carabao Cup operates under fundamentally different conditions that require purpose-built modelling approaches emphasizing variables that league models typically ignore or underweight.
Building a Carabao Cup-specific model means identifying which factors actually predict cup outcomes and which factors that work in league contexts fail in cup contexts. The rotation, motivation, and fixture-timing dynamics that define the competition create prediction opportunities for models that capture them—and systematic errors for models that don’t. Understanding what makes cup football different is the first step toward building models that exploit those differences.
This framework provides conceptual guidance rather than precise formulas. The specific weights and implementations will vary based on data availability, analytical sophistication, and individual betting objectives. But the variable identification and logical structure apply regardless of technical implementation. Even bettors without formal modelling capabilities can use this framework to organize their analysis and identify which information deserves attention.
Squad Rotation Variables
Rotation prediction forms the foundation of any Carabao Cup model because lineup differences explain more outcome variance than any other single factor. A model that accurately predicts rotation levels for both teams captures information that standard quality metrics miss entirely.
Manager rotation history provides the most reliable rotation predictor. Some managers consistently treat early cup rounds as development opportunities, fielding almost entirely reserve lineups. Others view every match as an opportunity to build winning mentality, maintaining stronger lineups than pure squad management would suggest. Tracking each manager’s historical cup rotation patterns—by round, opponent quality, and fixture context—creates prediction baselines that individual match circumstances then modify.
Fixture congestion affects rotation intensity predictably. Quantify congestion as days between matches, with particular attention to matches immediately before and after cup ties. A team playing Saturday-Tuesday-Saturday will rotate more heavily than a team with a free midweek. Create congestion scores for both teams that your model can weight alongside other factors.
Squad depth determines rotation capability. Elite clubs can rotate eight positions while maintaining quality advantages over lower-league opposition. Smaller Premier League clubs rotating heavily might field lineups barely superior to Championship opponents. Model squad depth as the quality gap between first-choice and likely rotation players, perhaps using transfer values or average league minutes as proxies.
Round-specific rotation patterns deserve distinct modelling. First and second round rotation differs from third round (when European clubs enter), which differs from quarter-finals (when survival matters more). Build round-specific baseline expectations that individual manager tendencies then modify.
Recent injury situations affect available rotation depth. Track injury news for both teams, understanding that injuries to first-choice players reduce rotation flexibility while injuries to squad players increase first-choice necessity. Model injuries as constraints on rotation capability rather than just quality reduction.
Motivation and Priority Variables

Motivation differentials affect cup outcomes in ways that league models don’t capture. A League One club facing Premier League opposition in a cup tie operates at maximum competitive intensity regardless of lineup quality. A Premier League club resting players for league priorities operates below maximum intensity. These differences don’t appear in quality metrics but significantly affect match dynamics.
Competition priority scoring attempts to quantify how much each team cares about winning. Consider factors like: league position security (clubs safe from relegation may prioritize cups), recent trophy history (clubs without silverware may value cups more), manager pressure (new managers may need cup progress for job security), and club culture (some clubs historically prioritize cups).
The round itself affects motivation asymmetry. Early rounds feature maximum motivation differential—lower-league clubs treating matches as season highlights while elite clubs treat them as squad management exercises. Later rounds see motivation convergence as Wembley proximity makes cups serious for everyone. Model declining motivation advantage for lower-league clubs as rounds progress.
Financial incentives matter more for lower-league clubs. Prize money and gate receipts from cup progression meaningfully affect small club budgets in ways that are irrelevant to Premier League clubs. This financial motivation produces extra effort that pure quality comparison misses.
Player-specific motivation creates individual performance variance. Young players seeking to impress, senior players wanting playing time, or contract-year players needing exposure all perform above baseline levels in cup fixtures. While difficult to model systematically, awareness of these dynamics improves interpretation of lineup implications.
Match Context Variables
Home advantage in cup football differs from league home advantage. The variables that create league home advantage—crowd support, travel fatigue, familiar surroundings—apply in cups but with modified intensity. Lower-league clubs hosting Premier League opposition often generate exceptional atmospheres that exceed their normal home advantage, while Premier League clubs hosting lower-league opposition sometimes see reduced home attendance that diminishes their advantage.
Pitch and facility factors affect quality gap expression. Lower-league pitches in worse condition reduce the quality differential that Premier League technical superiority would create on pristine surfaces. Smaller grounds with tighter dimensions reduce space advantages that possession-based teams typically exploit. Consider venue characteristics when modelling quality translation.
Weather conditions during the August-February cup window vary dramatically. Early rounds in August feature different conditions than quarter-finals in December. Model weather effects on match tempo, pitch condition, and scoring patterns appropriate to typical conditions at each round’s timing.
Television scheduling affects match intensity and atmosphere. Televised matches generate different crowd environments than non-televised fixtures. Premier League clubs may field stronger lineups when television attention makes cup ties more visible. Lower-league clubs may benefit from or struggle with enhanced occasion pressure.
Use statistical models by incorporating xG in cup matches.
Historical Cup Performance Variables
Club-level cup history provides baseline expectations. Some clubs consistently perform above or below their quality level in cup competitions. Liverpool’s record ten Carabao Cup titles reflects organizational cup competence; other elite clubs show weaker cup records. Track each club’s historical cup performance relative to quality level.
Manager-specific cup records deserve separate tracking. Some managers prioritize cups throughout their careers; others consistently underperform quality expectations in knockout competitions. Pep Guardiola’s Carabao Cup success at Manchester City demonstrates manager-level cup competence that applies across clubs.
Head-to-head history in cup competitions provides relevant precedent, though sample sizes typically remain small. When the same clubs have met in previous cup rounds, those matches better predict current cup dynamics than league meetings featuring different personnel and motivation levels.
Round-specific historical patterns reveal systematic dynamics. Upset frequency by round, goals per match by round, and penalty shootout rates by round all show patterns worth modelling. First-round fixtures historically produce different dynamics than quarter-finals regardless of which specific clubs participate.
Model Integration and Practical Application
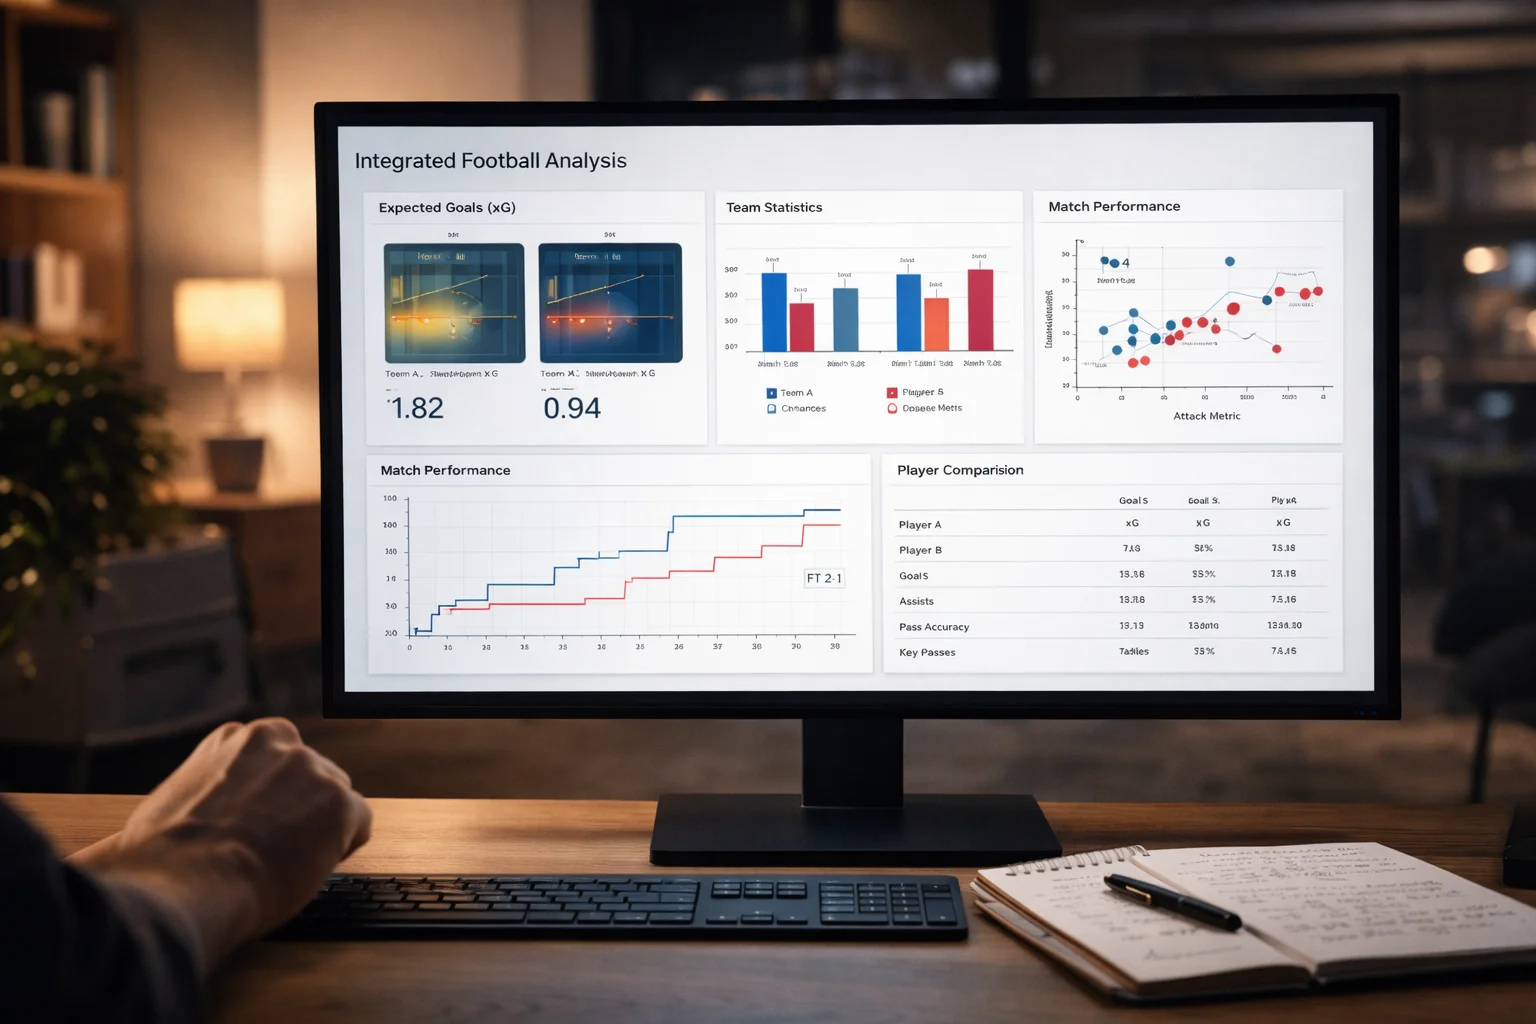
Combining these variables requires weighting decisions that depend on data availability and analytical objectives. Rotation prediction probably deserves highest weight because it most directly affects the quality that will actually appear on the pitch. Motivation variables deserve substantial weight in mismatched fixtures where quality gaps might be offset by effort differentials.
Pre-lineup models generate probability ranges that lineup confirmation then refines. Before team news, estimate likely rotation levels and generate outcome probabilities accordingly. Once lineups confirm, adjust those probabilities based on actual rotation versus expectation.
Validate model performance across historical cup data before applying to actual betting. Test whether your rotation predictions match actual historical rotation. Test whether your match predictions improve on baseline quality models. Refine weights based on performance feedback.
Accept higher uncertainty in cup modelling than league modelling. The factors that make cups interesting to model—rotation, motivation, upset potential—also make them inherently less predictable. Appropriate stake sizing accounts for this uncertainty; betting smaller amounts on higher-variance cup markets typically outperforms treating cup bets like league bets.
The goal isn’t perfect prediction—that’s impossible in cup football’s chaotic environment. The goal is better-than-market prediction, capturing factors that standard models miss. Even modest improvements in prediction accuracy compound into significant betting edge over many cup fixtures across multiple seasons.
Refine your prediction science on our English football portal.
