
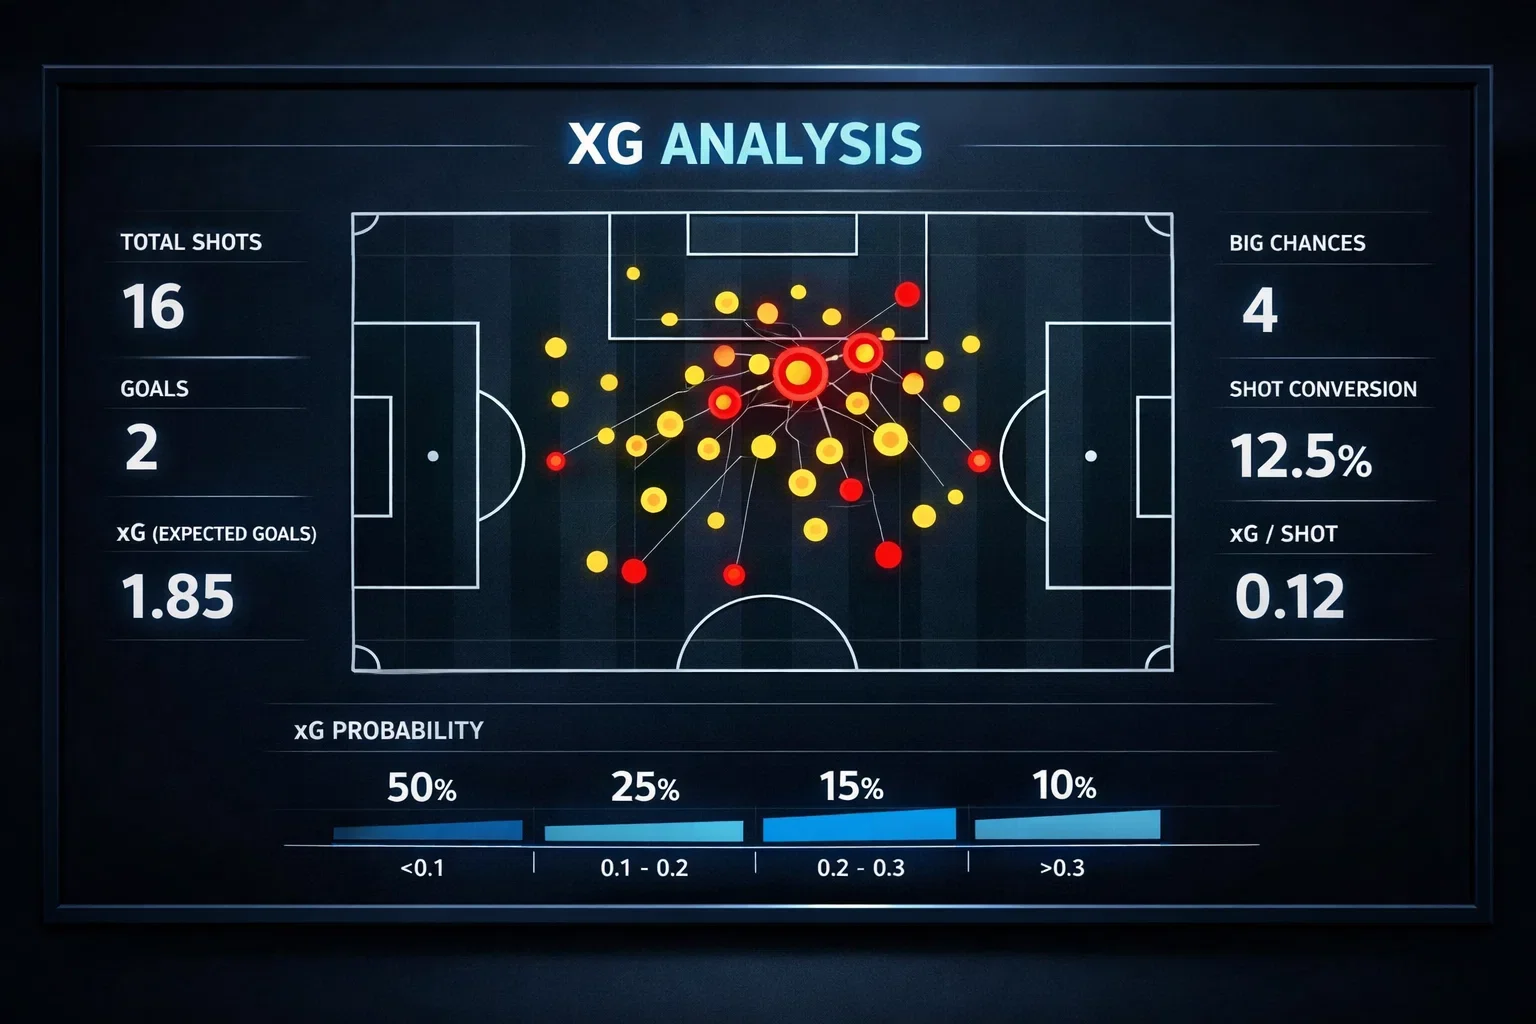
Expected goals has transformed football analysis over the past decade, providing a framework for evaluating chance quality that transcends simple shot counts or possession statistics. In league football, where teams field consistent lineups across dozens of matches, xG serves as a powerful indicator of underlying performance—identifying teams outperforming their finishing luck or defensive xG suggesting regression. But cup football operates under fundamentally different conditions, and applying xG frameworks designed for league consistency to Carabao Cup matches produces systematically misleading conclusions.
The core problem isn’t with xG methodology itself. Expected goals models accurately assess shot quality based on location, angle, body part, and assist type. A shot from seven yards remains a high-xG opportunity regardless of which player takes it. The problem emerges when bettors use historical xG data—compiled from league matches with first-choice players—to predict cup fixtures featuring dramatically different personnel. The model measures the shot correctly; the interpretation assumes the wrong shooters will take those shots.
Understanding why xG fails in cup contexts requires examining how rotation affects the entire chain of events that produces goalscoring opportunities. It’s not simply that reserve players finish chances differently—they create, prevent, and react to chances differently at every phase of play. Building betting strategies around xG for Carabao Cup matches means building on foundations that don’t account for the competition’s defining characteristic.
The Personnel Problem
xG models assign probabilities based on thousands of historical shots from similar positions. When Harry Kane receives the ball twelve yards from goal at a central angle, his historical conversion rate informs the xG value—but so do conversion rates from all players in similar positions. The model produces a probability that represents average expected finishing from that location. This works reasonably well in league football where elite finishers consistently receive chances in dangerous positions.
Cup rotation disrupts this assumption fundamentally. When a twenty-year-old academy striker replaces Kane in a third-round tie, the xG model still assigns the same probability to identical chances. But the young striker’s actual conversion rate from those positions likely differs significantly from the historical average—and almost certainly differs from Kane’s rate. The model cannot adjust for who takes the shot, only where and how.
This limitation cuts both ways. Elite finishers like Erling Haaland or Mohamed Salah consistently outperform xG because their finishing ability exceeds the average shooter’s capability from identical positions. When they’re rested for cup ties, the replacement players likely convert at rates closer to—or below—league averages. Backing overs based on xG generated by first-choice attackers systematically overstates goal expectation when reserves actually take those chances.
Defensive personnel changes create parallel problems. A team’s xG against (xGA) in league matches reflects their first-choice defenders’ positioning, pressing intensity, and recovery speed. When reserve center-backs or backup goalkeepers feature in cup ties, the quality of chances conceded often increases even if the quantity remains similar. The model might show similar xGA, but the actual conversion probability against weaker defenders exceeds what historical averages suggest.
Beyond Finishing: Creation and Prevention

The xG limitations in cup football extend beyond finishing variance to the entire chance creation process. First-choice creative players generate opportunities that reserve replacements cannot replicate. Kevin De Bruyne’s through balls create higher-xG chances than backup midfielders can produce from identical starting positions because the pass quality, timing, and vision differ fundamentally.
This creation gap means cup lineups often generate lower total xG than league lineups would against identical opposition, even before considering finishing variance. Bettors using a team’s league xG averages to predict cup scoring systematically overestimate attacking output. The chances that produced those league xG figures simply don’t occur when the creative architects rest.
Defensive chance prevention follows similar patterns. Elite defensive midfielders intercept passes that reserves miss. First-choice center-backs position themselves to block shooting angles that backup defenders leave open. The pressing intensity and coordination that suppress league opponents’ xG often disappears when makeshift defensive units take the pitch. Cup matches frequently produce higher xG totals for both teams than equivalent league meetings would generate.
The spatial dynamics of rotated teams differ from established partnerships. First-choice players develop movement patterns, combination play understanding, and positional relationships across months of shared training and competition. Reserve players fielded together for single cup ties lack this coordination. The disorganization produces both more speculative shooting (lower xG per shot but more total shots) and more defensive chaos (higher-quality chances conceded).
What Metrics Work Better
If xG misleads in cup contexts, what should bettors analyze instead? Several alternative frameworks suit cup-specific conditions better than shot-quality models designed for league consistency.
Manager rotation history provides more predictive value than team xG averages. Tracking which managers rotate heavily, which positions they protect, and how their reserve lineups have historically performed in cup ties offers practical insight that xG cannot capture. A manager who consistently fields strong attacking lineups but rotates defenders creates predictable patterns for BTTS or over/under betting regardless of what xG models suggest.
Individual player form and minutes data matters more than team-level xG. When you can identify which specific players will feature in cup ties, analyzing their recent individual performance provides better prediction bases than team averages. A reserve striker who scored in his last two substitute appearances represents different attacking threat than a youth player making his debut, even if team xG averages treat them identically.
Opposition quality and motivation assessment often outweighs statistical modelling. A League One club treating a Premier League cup tie as their biggest match of the season brings intensity that xG cannot measure. The motivational asymmetry between a lower-league club’s maximum effort and a Premier League reserve lineup’s casual approach creates match dynamics that statistical models miss entirely.
Set piece efficiency deserves more weight than open-play xG in cup contexts. Teams with strong dead-ball routines maintain that advantage regardless of rotation because set piece execution depends more on rehearsed patterns than creative individual brilliance. A club with excellent corner delivery and aerial threats can score from set pieces even when their open-play creation suffers from rotation.
Compare xG data with tactical set piece analysis for better accuracy.
Practical Betting Applications

Rather than abandoning statistical analysis entirely, bettors should adjust how they weight different information sources for cup betting. Reduce reliance on team-level xG averages by fifty percent or more for matches featuring significant rotation. Instead, focus on lineup-specific analysis once team news becomes available.
Monitor goalkeeper selection as a key defensive indicator. Backup goalkeepers often significantly underperform first-choice shot-stoppers in ways that xGA doesn’t fully capture. A third-choice keeper facing shots that the first-choice would save creates systematic under-betting value on opposition scoring markets—even when xG suggests defensive solidity.
Weight recent cup-specific performance over league xG data. How did this team’s reserve lineup perform in last round’s cup tie? What did their rotation look like in early cup rounds last season? These competition-specific data points predict better than league xG averages from first-choice lineups.
Consider xG variance rather than averages. Teams with high xG variance in league matches—sometimes creating many chances, sometimes few—likely show even higher variance in cup ties when creative personnel changes. Backing under goals when high-variance attacking teams rotate their creators sometimes offers value that average xG analysis would miss.
Accept that cup matches have higher inherent uncertainty than league fixtures. The personnel instability that makes xG unreliable also makes any statistical model less predictive. Betting strategies should account for this uncertainty through stake sizing, market selection (avoiding markets requiring precise prediction), and acceptance that cup betting involves larger error margins than league betting.
The sophisticated bettor uses xG as one input among many rather than primary prediction driver. For league betting, xG deserves substantial analytical weight. For Carabao Cup fixtures featuring rotated squads, it becomes background context at best—and actively misleading at worst. Recognizing this limitation doesn’t mean abandoning analysis; it means adapting analytical frameworks to match competition realities.
Spot value picks on our EFL wagering hub.
