
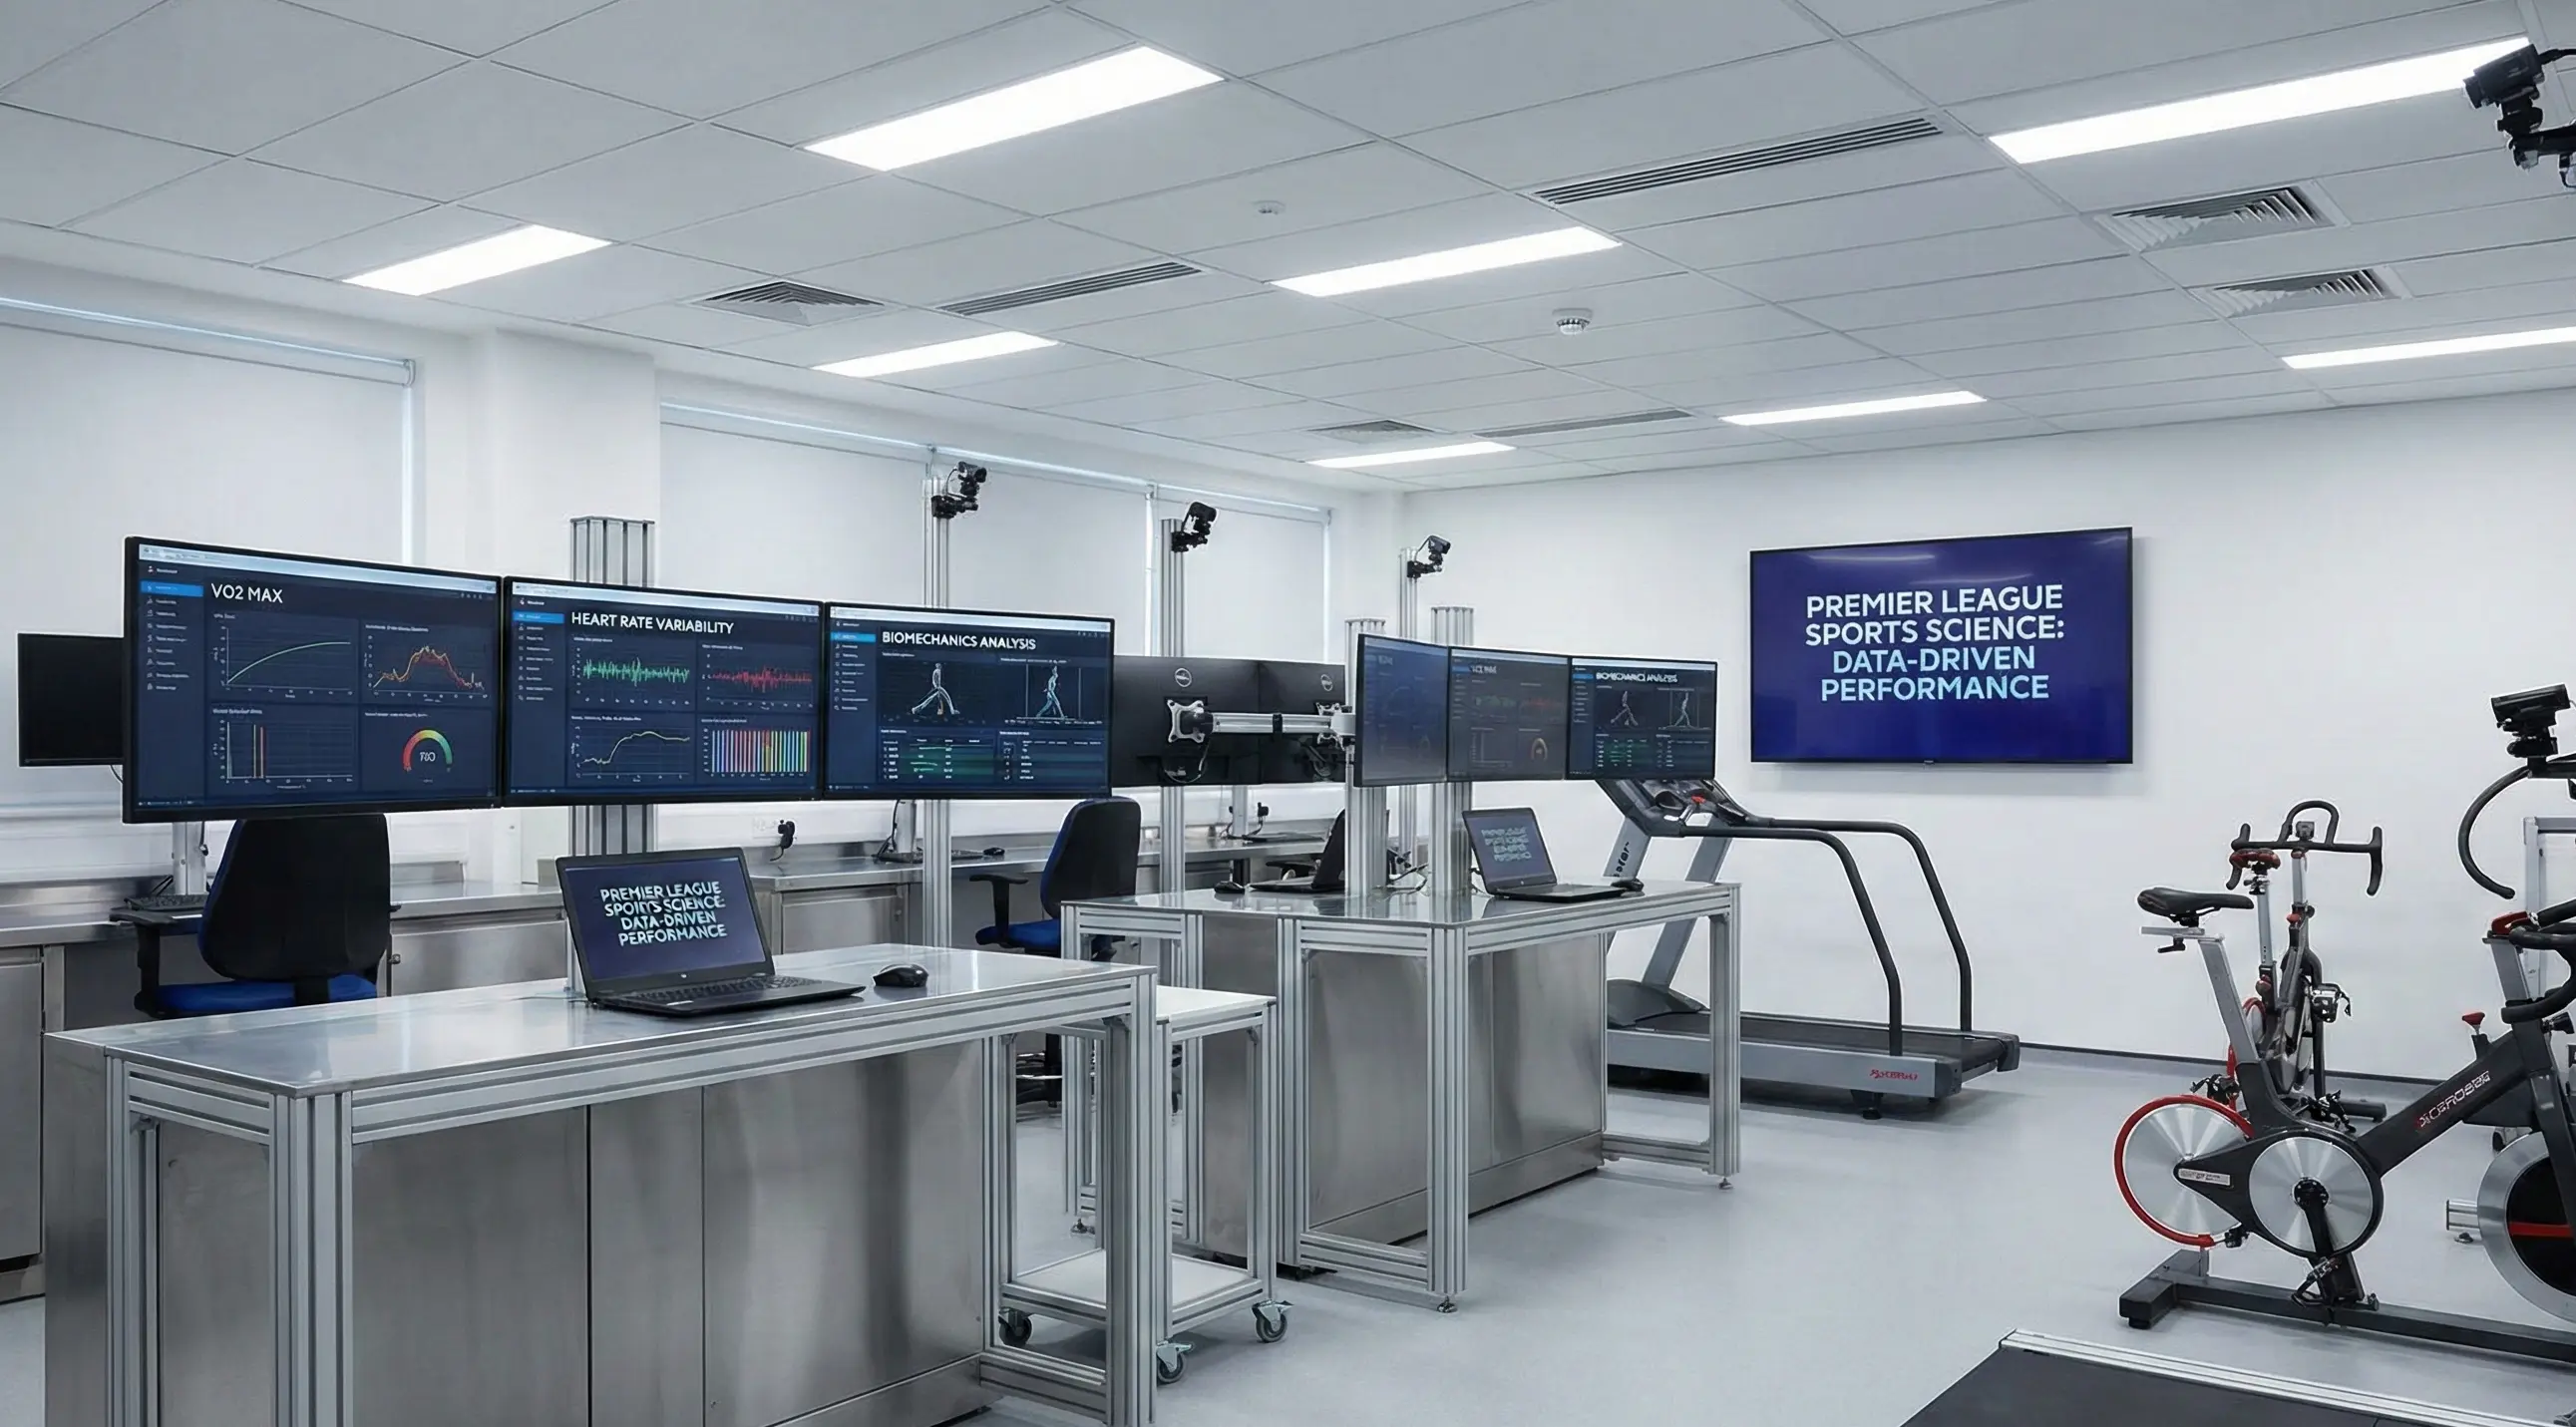
Elite football operates on the edge of what human physiology can sustain. The difference between adequate recovery and insufficient recovery separates peak performance from compromised output, and that difference often amounts to just 12 or 24 hours. Sports science has established 72 hours as the minimum threshold for high-intensity match recovery, yet fixture schedules routinely violate this standard. Understanding exactly how recovery time affects performance—and when it matters most—creates betting edge in competitions like the Carabao Cup where fixture density forces clubs into suboptimal preparation.
The 72-hour rule isn’t arbitrary. It reflects the time required for muscle glycogen replenishment, inflammatory response resolution, and neuromuscular function restoration following competitive match play. Players completing 90 minutes of Premier League football experience micro-tears in muscle fibers, depleted energy stores, and elevated stress hormones. These processes require time to reverse; cutting that time short means entering the next match with accumulated damage rather than full restoration.
The Science Behind Recovery Windows
Post-match recovery follows predictable phases that sports scientists have mapped through blood markers, muscle biopsies, and performance testing. Immediately following a match, muscle damage peaks and inflammatory markers surge. Over the next 24 hours, the body initiates repair processes while clearing metabolic waste. By 48 hours, most acute inflammation resolves, but muscle function remains compromised. Full restoration typically requires 72 to 96 hours, with individual variation based on player age, fitness level, and match intensity.
Research from Manchester Metropolitan University examining fixture congestion found that overall injury risk increases during periods with sub-72-hour recovery windows. The risk elevation isn’t linear—it accelerates as recovery time shortens. Moving from 96 hours to 72 hours between matches produces modest risk increase; moving from 72 hours to 48 hours produces dramatic escalation.
Muscle injuries dominate the congestion injury profile. Hamstring strains, quadriceps tears, and calf injuries occur disproportionately when recovery windows shrink. These soft-tissue injuries reflect the specific failure mode of insufficient recovery: muscles forced to perform before repair processes complete.
The betting implication extends beyond injury probability to performance degradation. Players competing on insufficient recovery don’t just face higher injury risk—they perform worse even when injury doesn’t occur. Sprint speeds decline; reaction times lengthen; decision-making under pressure deteriorates. These effects compound when multiple players on the same team share inadequate recovery, creating squad-wide performance drops that odds may not reflect.
Measuring Recovery Windows Accurately
Calculating recovery time requires precision beyond counting calendar days. A match on Saturday 3pm followed by a match on Tuesday 8pm provides 101 hours of recovery—comfortable by any standard. A match on Saturday 5:30pm followed by a match on Tuesday 12pm provides only 66.5 hours—well below optimal thresholds. Both might be described as “three days’ rest,” but the actual recovery windows differ by 34 hours.
Kickoff times matter enormously. Evening matches followed by early afternoon matches create the tightest windows. Early afternoon matches followed by evening matches create the most generous windows within the same calendar spacing. Track actual kickoff times when evaluating fixture sequences, not just dates.
Travel compounds recovery challenges. An away match requiring overnight hotel stays, flights, and bus transfers extracts additional energy before the physical match demands begin. A club playing away in Europe on Thursday, flying home overnight, then facing a Carabao Cup tie on Tuesday has less effective recovery time than the hours suggest. Factor travel into recovery calculations by adding approximately 12-24 hours of equivalent fatigue for significant journey distances.
The match itself affects recovery requirements. A 90-minute physical battle against aggressive opposition depletes more than a comfortable victory against overmatched opponents. Extra time and penalty shoot-outs extend exertion by 30-45 minutes, pushing recovery demands higher. Consider previous match intensity, not just result, when estimating squad freshness.
The Cascading Effect of Sequential Short Recovery
Single matches on short recovery produce manageable performance drops—perhaps 5-10% decline in key metrics. The serious degradation occurs through sequences: multiple matches with inadequate recovery between each create compounding fatigue that doesn’t reset between games.
Sports scientists have identified “congestion chains” as particularly damaging—three or more consecutive matches with sub-72-hour recovery between each. Players in these chains show progressively worse performance metrics: first match in the chain shows minor drops; second match shows moderate drops; third and subsequent matches show severe degradation. The fatigue accumulates faster than partial recovery can offset.
Club-level congestion chain analysis reveals which teams enter Carabao Cup matches mid-sequence versus relatively fresh. A club whose cup tie falls as their fifth match in 14 days—the third consecutive match with sub-72-hour recovery—will field players whose bodies have accumulated damage across the entire sequence. Backing their opponents gains value even if individual match spacing seems adequate.
The recovery context matters more than isolated fixture spacing. A cup match following 80 hours of recovery sounds reasonable until you learn it follows three previous matches with similar spacing. The 80 hours represents opportunity to continue accumulating fatigue rather than genuine recovery.
Position-Specific Recovery Demands
Different positions impose different physical demands, creating position-specific recovery requirements. Understanding which positions suffer most from insufficient recovery improves betting analysis on player-specific markets and formation predictions.
Central midfielders typically cover the most ground during matches—often 11-13 kilometers per 90 minutes. Their recovery demands are highest among outfield players, and they show the most dramatic performance drops on insufficient recovery. Expect rotating managers to protect central midfielders most aggressively; expect tired central midfielders to underperform most visibly.
Full-backs face unique demands combining high running distances with repeated sprint sequences. Modern overlapping and inverting full-back roles create positional demands that exhaust practitioners quickly. Full-back rotation happens frequently in cup matches precisely because the position’s physical demands exceed most players’ recovery capacity during congested periods.
Center-backs cover less ground but face different fatigue challenges. Their demands center on concentration, positioning, and aerial duels rather than sustained running. Mental fatigue affects center-backs as much as physical fatigue—tired minds lose focus, miss covering positions, and misjudge challenges. Center-back partnerships built on communication and anticipation suffer when either partner plays through mental fog.
Strikers present variable profiles depending on role. Deep-lying forwards covering defensive pressing duties face physical demands similar to midfielders. Penalty-box strikers focused on finishing face lower running demands but may actually require more recovery for explosive movements—the sprints and jumps that define goalscoring opportunities deplete fast-twitch muscle fibers that recover more slowly than slow-twitch endurance fibers.
Goalkeepers require less physical recovery but face unique psychological demands. Shot-stopping requires reaction-time sharpness that diminishes with fatigue. Distribution accuracy declines when tired. The mental burden of concentration across 90 minutes without rest creates its own recovery requirements. Cup goalkeeper rotation often reflects rest priority for first-choice keepers rather than development opportunities for backups.
Market Applications for Recovery Analysis
Several betting markets respond predictably to recovery time differentials, creating systematic value opportunities.
Asian handicaps: Favorites on short recovery struggle to cover large handicaps even when winning. Their performance margin shrinks; comfortable victories become narrow victories. Back underdogs on Asian handicap when recovery time differential favors the underdog by 24+ hours.
First-half goals: Tired teams start slowly. The adrenaline and focus that mask fatigue require time to kick in. First-half unders gain value when both teams enter with inadequate recovery. First-half overs gain value when a rested team faces a fatigued opponent—the rested team can press immediately while the tired team struggles to match intensity.
Total goals: Recovery affects attacking more than defending in early match phases but defensive concentration in late phases. The net effect on total goals depends on match context, but generally, both-teams-tired matches produce fewer goals than one-team-tired matches. The rested team creates and converts more opportunities; the mutual fatigue match sees both teams conserving energy.
Cards and fouls: Fatigued players commit more fouls. Tired legs produce mistimed tackles; frustrated minds produce cynical interventions. Cards markets—total bookings, individual player cards, booking points—gain value backing overs when recovery context predicts increased foul frequency.
Corners: Tired defensive clearances produce more corners. The precision required for clean headed clearances or controlled defensive passes deteriorates with fatigue. Back corner overs in matches featuring fatigued defensive units, particularly in second halves when accumulated match fatigue compounds pre-match recovery deficits.
Building Recovery Into Prediction Models

Effective recovery analysis requires systematic tracking across the season. Build a database recording each club’s fixture dates, kickoff times, travel distances, and match durations (including extra time).
Calculate rolling recovery metrics for each club entering each fixture. Weight recent matches more heavily—a match three days ago affects current state more than a match ten days ago, even if total match count is identical. Create recovery scores that account for match intensity, travel demands, and sequential short-recovery chains.
Compare recovery scores between opponents for each Carabao Cup match. The differential predicts performance gap more accurately than form tables or league position. A mid-table club well-rested may outperform an elite club mid-congestion-chain, even though conventional analysis favors the elite club.
Update recovery models throughout the season as fixture dates confirm and injury news reveals which players actually participated in previous matches. A club that rested key players in the previous match enters the cup tie fresher than one that played a strong eleven—even if calendar spacing is identical.
The 72-hour rule provides the foundation, but sophisticated analysis builds from there. Recovery isn’t binary—adequate or inadequate—but graduated. Every hour matters; every match adds load; every rest day provides restoration. Quantifying these dynamics enables betting decisions that capture value the market systematically underprices.
